
As we mentioned earlier, if you are running a carbon project on your property, you’re probably aware of the ongoing controversy that surrounds the amount of actual carbon abatement being achieved. Some of this criticism has been directed at HIR projects.
A small (but loud) group of researchers and writers have argued that HIR activities don’t really have much influence on gains in native forest regeneration on these projects in Australia.
They claim to have found “limited evidence of regeneration in credited areas”, stating that any regeneration that did take place is attributable to rainfall, not management of grazing pressure and other factors that form part of HIR project interventions. Many members of the media accepted this on face value.
A little while back, our Head of Science, Dr Cathy Waters, and other scientists, looked a bit deeper into this in order to address the shortcomings of the assertions that form the basis of these claims.
Their analysis was published in the journal, ‘Communications Earth and Environment’.
“In this short article, we are setting out to put your mind at rest by outlining the technical and scientific reasoning that explains why this criticism is incorrect and misleading.”
Identifying ‘forest’
The basis for some of the key criticism was drawn from analysis of the use of ‘forest attainment’ as a criteria for assessing the impact and success of HIR projects.
It is important to understand that ‘forest’ in the rangelands, where HIR projects are conducted, is very different to that in, for example, a rainforest in far north Queensland.
For the purposes of the Australian Carbon Credit Scheme, a forest is defined as woody vegetation that is at least two metres tall with a canopy cover of 20% over 0.2 hectares – a lot less than the dense canopy in rainforests.
This criticism we are referring to uses the Australian Government’s National Forest and Sparse Woody Vegetation (NFSWV) data set.
This data set is derived from Landsat imagery and was designed to assess national-scale changes in woody vegetation cover.
The critics looked at this data in relation to 182 HIR projects in Australia.
Landsat imagery is high-quality satellite imagery of Earth’s land surfaces.
It has been collected jointly by NASA and the US Geological Survey on a continuous basis since 1972.
Researchers have used Landsat’s archive to study how cities have grown, coastlines have shifted, crop cycles have changed and how forests have transformed.
These are broad changes detected over a landscape.
Since 1988, it has also provided imagery that tracks changes in woody vegetation cover, updating it on an almost annual basis.
Cathy and her colleagues compared this publicly available NFSWV data to high-resolution airborne LiDAR obtained from representative HIR project sites in the Queensland, New South Wales and Western Australia rangelands.
(LiDAR is an active remote sensing technology that uses laser light pulses to measure distances and create precise, 3D representations of environments and objects).
In looking further into the analysis that forms the foundation of the criticisms, another important point to understand is that the NFSWV images are taken from space and are made up of pixels that each represent approximately 30 square metres of land.
Though this means large areas of land can be captured, the resolution is not high – it is not detailed enough to detect changes in individual plants or at the property scale, where carbon projects operate.
In contrast, LiDAR has a much finer spatial resolution, capable of charting an individual tree or stand of vegetation.
Categorising growth phases
These NFSWV satellite images classify the density of vegetation into three categories: non-woody (less than 5% cover), sparse woody (5-19% cover) and forest (20% cover or more).
The illustration below shows what this looks like.
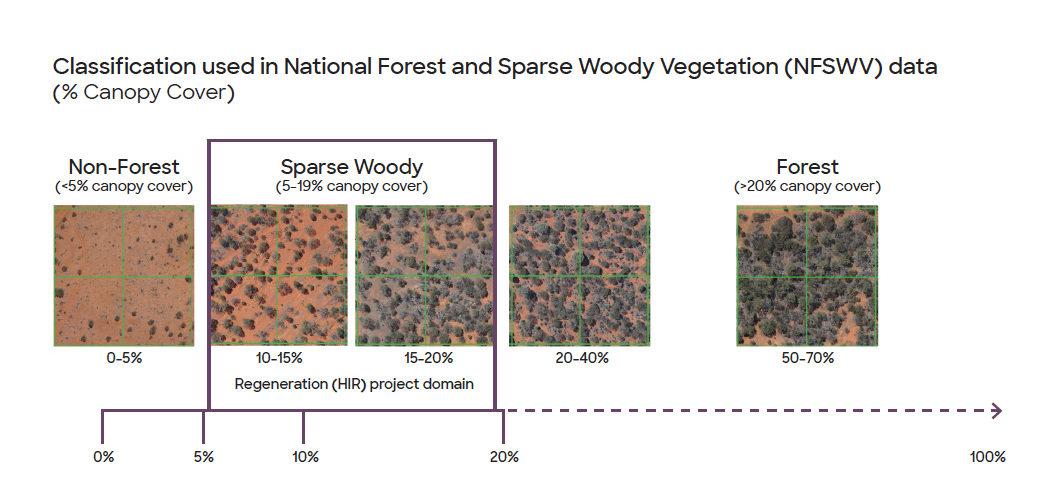
Figure 6: The NFSWV forest classification uses three vegetation classes (Non-Forest; Sparse Woody and Forest). NFSWV data cannot detect crown cover changes within classes and will therefore fail to reflect the growth in regenerating and existing forests (i.e. changes in canopy cover between 5-20% or >20%).
The classification of this imagery into these three categories is driven by the level of detail that the imagery can detect.
While it is sufficient to group stands of vegetation into each of these three categories of growth, there is no finer detail available.
This means that only changes between categories can be detected.
Changes that occur within a category can not be detected.
The growth in HIR projects, which absorbs and stores carbon as trees regenerate – and is measured to generate credits, takes place wholly within the ‘sparse woody’ category.
Under the HIR method, evidence of this transitioning growth must be tracked over a 15-year timeframe, using regular ‘gateway checks’.
It is during this growth phase that the trees absorb and store carbon, every tonne of which generates a carbon credit.
Only areas that pass gateways can generate credits.
The 15 year timeframe is a representation of how long it takes these trees to grow to a point where they can satisfy the technical definition of ‘forest cover’.
Our investigation of the claims
As we have explained, the classification system on which the criticisms rely can only detect whether vegetation fits into one of the three categories.
It cannot detect if growth is ‘taking place’ within the middle ‘sparse woody’ category.
However, LiDAR can detect this detail and, along with on ground measurement, has provided the evidence that these claims are wrong.
Additionally, on a number of occasions, tests by Cathy’s team have shown that the analysis the critics conducted miscategorised the vegetation.
Specifically, NFSWV detected 40% less sparse woody vegetation than LiDAR.
This was mostly in relation to early stage regeneration, which NFSWV categorised as sitting within the ‘non-forest’ category.
It also commonly misrepresented forest cover (>20%) as sparse woody vegetation.
Another point that is critical to understand is that all HIR projects are only in their early to mid-life stages. The oldest projects are less than 10 years old. So none of these projects are near transitioning to forest cover (the 15 year point).
Ill-matched comparison areas
The analysis the critics undertook also relied on the use of comparison areas, which are a standard feature of experimental design.
Good quality comparison areas would feature similar initial vegetation condition, soil properties, hydrological regimes, fire history, historical and current land management practices, and so on.
However, rather than undertaking research that would identify areas in the proximity that would approximate the landscape and condition of the projects areas, they simply looked at areas that were within 3km of the project perimeter.
This resulted in poorly matched comparison areas which differed significantly in size and character.
This comparison could not therefore be relied upon to indicate whether regeneration was the result of HIR processes that did not exist before the project, or not.
Why this matters
This sort of flawed analysis has driven significant criticism of HIR projects.
We wanted to provide you with evidence and reassurance that it is incorrect.
Though the HIR method has come to an end (‘sunsetted’) and no new HIR projects can commence, the existing projects continue toward forest attainment and their permanence period.
The projects we have developed with landholders operate under the highest levels of scientific and technical knowledge available to us today. And we continue to update our processes as advances in technology and science develop.
We stand by our projects.
This sort of criticism will continue and we will continue to sense check it and defend our partners and projects against inaccuracy.